
If you build your website with the WordPress block editor, you have probably heard that ‘speed matters’ for both users and Google. But when you open a speed test report, it throws around terms like LCP, INP, CLS,TTFB and suddenly everything feels confusing. Core Web Vitals for Block Editor Sites are simply the numbers Google uses to measure how fast, stable and responsive your Gutenberg pages feel to real people.
In this guide, we break down 10+ must-know performance terms in plain language so you can read any report with confidence. No coding degree required and no jargon left unexplained.
What Are Core Web Vitals (And Why Block Editor Users Should Care)
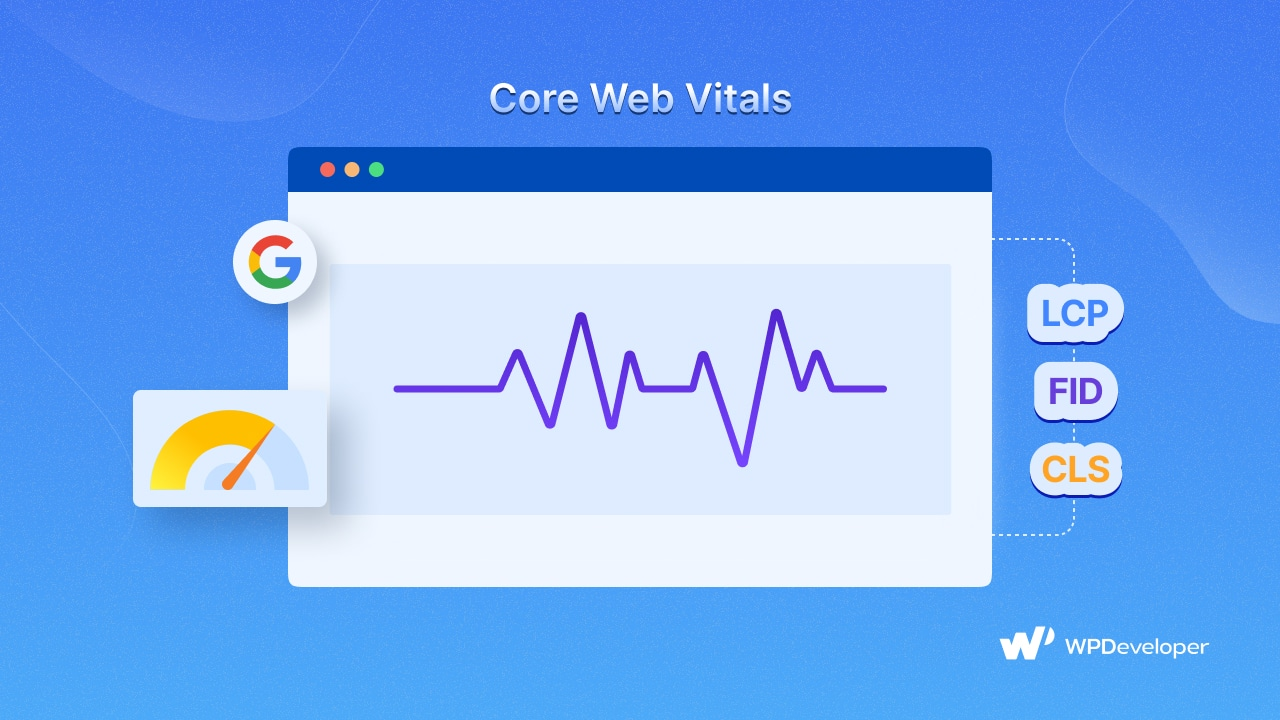
Core Web Vitals are a small set of metrics created by Google to measure the real experience people have on your website. Instead of guessing, Google looks at three things: how quickly your main content loads, how fast your page reacts when someone taps or clicks and how stable your layout stays while everything loads in.
According to Google’s official documentation, these vitals are part of the broader page experience signals that help search rankings.
For block editor (Gutenberg) websites, this matters even more. Every block you add loads its own styles and sometimes its own scripts. A page packed with sliders, galleries and animated counters can quietly pile on weight and hurt your scores. The good news is that once you understand the terms behind the numbers, fixing them becomes far less scary.
Before we jump into the full list, remember one thing. Google measures these scores from real visitors over a rolling 28-day window, not from a single test on your fast laptop. So your goal is to build pages that stay quick for everyone, including someone on a mid-range phone with patchy mobile data.
The 3 Core Web Vitals Every WordPress User Must Know First
These first three terms are the heart of everything. If you learn nothing else, learn these. Together they decide whether Google marks your page as ‘good’, ‘needs improvement ’ or ‘poor’.
1. Largest Contentful Paint (LCP)
Largest Contentful Paint measures how long it takes for the biggest visible element on your screen to load. Usually, this is a hero image, a large heading or a banner at the top of your page. Think of it as the moment your visitor feels like ‘okay, the page has loaded.’
Google’s web.dev learning hub sets the target at 2.5 seconds or less for a good score. Anything between 2.5 and 4 seconds needs improvement and anything above 4 seconds is poor. On block editor sites, oversized hero images and heavy header blocks are the most common reasons LCP drags. Compressing that top image is often the single fastest win you can make.
2. Interaction to Next Paint (INP)
Interaction to Next Paint measures how quickly your page responds when a visitor does something like clicking a button, tapping a menu, or opening an accordion. It looks at every interaction during the visit and reports the slowest one, which makes it a strict and honest measure of responsiveness.
INP officially replaced the older First Input Delay metric in March 2024. The good target is 200 milliseconds or less. INP is often the hardest vital to pass because the usual culprit is heavy JavaScript blocking the browser. If your Gutenberg page uses lots of interactive blocks with unoptimized scripts, this is where you will feel the pain.
3. Cumulative Layout Shift (CLS)
Cumulative Layout Shift measures how much your page jumps around while it loads. You have felt this yourself. You go to tap a link and an image suddenly loads above it, pushing the link down so you tap the wrong thing. That annoying jump is exactly what CLS captures.
A good CLS score is 0.1 or less. The most common causes on block editor sites are images without set width and height, ads or embeds that load late and web fonts that swap in and shift text. Reserving space for these elements keeps your layout calm and steady.
Now that you know the three headline vitals, the next terms explain the smaller signals that feed into them. Understanding these will help you figure out why a vital is failing in the first place.
Loading Speed Terms That Shape Your LCP
Your LCP score does not exist in a vacuum. Several supporting metrics appear before your main content appears. If you know these, you can pinpoint exactly where the delay is coming from.
4. Time to First Byte (TTFB)
Time to First Byte is the time between a visitor requesting your page and the first byte of data arriving back from your server. In simple words, it measures how quickly your hosting responds. A good TTFB is around 0.8 seconds or less.
TTFB is not a Core Web Vital itself, but it comes before everything else. If your server is slow to respond, a fast LCP becomes almost impossible. Cheap shared hosting, missing caching and being far from the server are the usual reasons TTFB climbs. This is why hosting quality quietly shapes your entire performance profile.
5. First Contentful Paint (FCP)
First Contentful Paint marks the moment the browser paints the very first piece of content, such as a bit of text or a background color. It tells your visitor the page is alive and doing something. A good FCP is 1.8 seconds or less.
A big gap between TTFB and FCP usually means the browser is stuck downloading render-blocking files before it can show anything. On Gutenberg sites, this often points to bloated CSS from too many active blocks.
6. Render-Blocking Resources
Render-blocking resources are CSS and JavaScript files that the browser must load and process before it can display your page. Until these are handled, your visitor stares at a blank screen. Since the block editor loads styles for each block type, unused block CSS can easily become render-blocking dead weight.
The fix is to defer non-critical scripts, inline the most important styles and load only what the page truly needs. Plugins like Essential Blocks help here by letting you enable only the individual blocks you actually use, so you are not shipping code for features you never touched.
7. Critical CSS
Critical CSS is the small slice of styling needed to display the top of your page, the part visitors see first before scrolling. By loading this tiny chunk immediately and delaying the rest, your page paints its visible area much faster. This directly improves FCP and LCP. Many caching plugins can generate critical CSS automatically, so you do not have to hand-write it.
Responsiveness Terms That Shape Your INP
If your buttons feel laggy or your menus open slowly, the cause almost always lies in this group of terms. They all revolve around one thing: JavaScript and how it uses the browser’s main thread.
8. Total Blocking Time (TBT)
Total Blocking Time measures how long the browser’s main thread was blocked and unable to respond to the user during page load. It is a lab metric, which means testing tools can measure it at any time without waiting for real visitors. A good TBT is 200 milliseconds or less.
TBT is a strong preview of your INP problems. If TBT is high in a lab test, real users are likely feeling lag too. The two share the same root cause, which is heavy JavaScript.
9. Main Thread
The main thread is the single lane where the browser does most of its work, including running JavaScript and responding to clicks. When a long task hogs this lane, everything else waits. Imagine a one-lane road blocked by a slow truck. Nothing moves until it clears.
Every interaction on your page competes for this one thread. Keeping it free is the secret to snappy responsiveness.
10. Long Tasks
A long task is any piece of JavaScript that runs for more than 50 milliseconds and holds up the main thread. Stack a few of these together and your buttons start to feel unresponsive. Third-party scripts like chat widgets, heavy analytics and unoptimized block libraries are common offenders. Breaking large tasks into smaller chunks lets the browser breathe between them.
11. JavaScript Deferring
JavaScript deferring tells the browser to load a script later instead of right away, so it does not block your page from rendering. The defer and async attributes do this job. On block editor sites that stack many interactive elements, deferring non-essential scripts is one of the most effective ways to protect both INP and TBT.
Visual Stability & Efficiency Terms That Round It Out
The final group covers stability and smart loading. These terms help your page feel polished and load only what is needed, exactly when it is needed.
12. Lazy Loading
Lazy loading delays loading images, videos and iframes until they are about to enter the visitor’s screen. Instead of loading forty images at once, your page loads the few that are visible and fetches the rest as the user scrolls. This lightens the initial load dramatically and helps LCP.
WordPress adds lazy loading to images by default, but you get the best results by controlling it carefully. One important tip: never lazy-load your hero image or main LCP element, because delaying it will actually hurt your score. Some block plugins even give you a “disable lazy load” toggle for exactly this reason.
13. Image Optimization
Image optimization means shrinking image file sizes without ruining their quality. Since images often make up around half of a page’s total weight, this is one of the highest-impact fixes available. Using modern formats like WebP or AVIF, resizing images to the dimensions you actually display and compressing them can transform your LCP.
For a deeper walkthrough, WPDeveloper’s guide to WordPress site performance strategies covers image optimization, compression tools and format choices step by step, and Essential Blocks’ guide on speeding up a block editor site walks through the block-level tactics that pair well with it.
14. Caching
Caching stores a ready-made version of your page so the server does not have to rebuild it from scratch for every visitor. When someone lands on your site, they get the lightweight saved copy instead of a fresh, heavy build. This slashes TTFB and speeds up the whole experience. Caching is often the single biggest speed upgrade a WordPress site can get and most quality hosts or caching plugins set it up in minutes.
15. Field Data vs Lab Data
This last term ties everything together. Field data is the real-world performance collected from actual visitors through Google’s Chrome User Experience Report. Lab data is a controlled test run by tools like Lighthouse in a simulated environment.
Here is why it matters. Google judges whether you pass Core Web Vitals using field data, not lab data. Lab data is still useful because it helps you debug and reproduce problems quickly. The smart approach is to use field data to know if you pass and lab data to figure out why. Remember that field data updates on a 28-day rolling window, so give any fix a few weeks before judging whether it worked.
How Block Editor Sites Can Put These Terms Into Action
Knowing the terms is half the battle. The other half is applying them without feeling overwhelmed. Start by running your key pages through PageSpeed Insights and checking the Core Web Vitals report in Google Search Console. This tells you which vital is weakest.

- Run your key pages through PageSpeed Insights.
- Check the Core Web Vitals report in Google Search Console to see which vital is weakest across your site.
- Fix in order of impact: Tackle whichever metric is in the ‘poor’ band first.
- Prioritize from there: INP tends to be the hardest, so it deserves early attention; LCP usually carries the biggest business impact and CLS is often the easiest to clean up with set dimensions. Do not waste effort polishing a metric that is already green.
- Apply Gutenberg-specific habits: Keep only the blocks you use active, compress your hero and above-the-fold images, reserve space for embeds and ads to stop layout jumps and lean on a caching solution to protect your TTFB.
Lightweight block libraries like Essential Blocks are built with this modular, load-only-what-you-need philosophy, which makes staying fast much easier than wrestling with a bloated page builder.
Start Measuring & Winning Your Web Vitals Today
Core Web Vitals for Block Editor Sites stop being intimidating the moment you understand the vocabulary behind the numbers. LCP, INP and CLS tell the main story, while supporting terms like TTFB, TBT, lazy loading and caching help you find and fix the root cause. You do not need to memorize every millisecond threshold. You just need to know what each term means and which lever to pull when a score dips.
Pick one page today, run it through PageSpeed Insights and match the warnings to the 15 terms you just learned. With a lightweight block setup, smart image handling and solid caching, your Gutenberg site can hit those green scores and give both Google and your visitors exactly what they want: a fast, stable and responsive experience.
If you found this guide helpful, subscribe to our blog for more Gutenberg design tutorials, and join our Facebook community to stay connected with new features, tips and announcements.